
Overview#
Every well-level screen mantispy.ds serves, with how many wells, features and controls it has, and how many cells a
well holds.
import matplotlib.pyplot as plt
import numpy as np
import pandas as pd

import mantispy as mt
WELLS = [
    "bbbc021",
    "rohban",
    "pki",
    "jump_target2",
    "jump_crispr",
    "neuropainting",
    "chroma",
    "oasis_pilot",
]
datasets = {name: getattr(mt.ds, name)() for name in WELLS}

rows = []
for name, adata in datasets.items():
    obs = adata.obs
    rows.append(
        {
            "dataset": name,
            "accession": adata.uns["mantispy"]["dataset"],
            "wells": adata.n_obs,
            "features": adata.n_vars,
            "plates": obs["Metadata_Plate"].nunique(),
            "controls": int(obs["Metadata_Control"].sum()) if "Metadata_Control" in obs else pd.NA,
            "cells per well": obs["Metadata_CellCount"].median(),
            "fields per well": obs["Metadata_SiteCount"].median() if "Metadata_SiteCount" in obs else pd.NA,
        }
    )
pd.DataFrame(rows).set_index("dataset")
| accession | wells | features | plates | controls | cells per well | fields per well | |
|---|---|---|---|---|---|---|---|
| dataset | |||||||
| bbbc021 | BBBC021 | 632 | 467 | 55 | 330 | 592.0 | 4.0 |
| rohban | cpg0017-rohban-pathways | 1918 | 3616 | 5 | 120 | 633.0 | 9.0 |
| pki | cpg0008-pki | 3072 | 5839 | 8 | 832 | 1669.0 | 9.0 |
| jump_target2 | cpg0016-jump | 5374 | 3616 | 11 | 898 | 1427.5 | 9.0 |
| jump_crispr | cpg0016-jump-assembled | 51185 | 595 | 148 | 7478 | 3093.0 | <NA> |
| neuropainting | cpg0038-tegtmeyer-neuropainting | 1691 | 204 | 4 | <NA> | 92.0 | 4.0 |
| chroma | cpg0029-chroma-pilot | 3455 | 64 | 8 | 216 | 625.0 | 9.0 |
| oasis_pilot | cpg0033-oasis-pilot | 4604 | 99 | 12 | 511 | 4443.5 | 9.0 |
controls is Metadata_Control, which the loaders of bbbc021, rohban, pki, jump_target2, jump_crispr and
oasis_pilot set.
chroma marks its untreated wells negcon in Metadata_control_type instead.
Five datasets are left out of the table:
pooled_rareholds one profile per barcode of a pooled screen, so there is no well to count cells in;jump_cellsholds 13,578 single cells of one JUMP plate, see its page;jump_plateholds the images and segmentations of one well of the same plate;jump_exportis the CellProfiler export directory of one field of view of that plate;jump_liteholds the same 1,536 JUMP wells under six feature sets, see its page.
Where the cell counts come from#
Metadata_CellCount is the number of cells behind a row, and Metadata_SiteCount the number of fields of view
that contributed cells.
Every count is exact, taken from what the upstream pipeline measured:
dataset |
cell count |
|---|---|
bbbc021 |
summed from the |
rohban, pki |
|
oasis_pilot, chroma |
|
neuropainting |
|
jump_target2 |
each plate’s backend table, see its page |
jump_crispr |
|
Metadata_Object_Count is the number of cells pycytominer aggregated into a well.
It equals Metadata_Count_Cells in every well of every file here that publishes both, so it is as exact.
read_profiles() copies either one to Metadata_CellCount, and Metadata_Site_Count to Metadata_SiteCount, so a Gallery file read directly carries them too.
Cells per field#
Datasets image different numbers of fields per well, and so do plates within some of them. Cells per field compares them on one scale.
per_field = {
    name: (adata.obs["Metadata_CellCount"] / adata.obs["Metadata_SiteCount"]).dropna().to_numpy()
    for name, adata in datasets.items()
    if "Metadata_SiteCount" in adata.obs
}
order = sorted(per_field, key=lambda name: np.median(per_field[name]))
fig, ax = plt.subplots(figsize=(8, 4))
ax.boxplot([per_field[name] for name in order], tick_labels=order, showfliers=False)
ax.set_yscale("log")
ax.set_ylabel("cells per field of view")
ax.tick_params(axis="x", rotation=45)
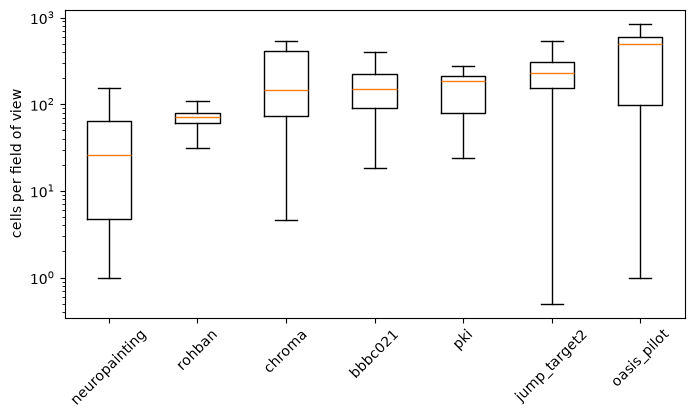
Metadata_SiteCount counts the fields of view that contributed cells, which need not be all those imaged: an empty field
contributes none, and so does one left out of the analysis.
JUMP-Target-2 has examples of both.
jump_crispr has no field count, because the recipe’s table publishes none.